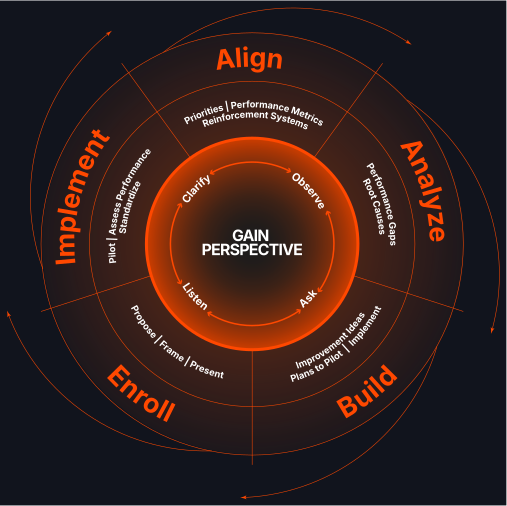
The mistakeis analyzing alone and arriving with the answer.
It usually feels like diligence. You have looked at the data, formed a view, built the case and brought it to people ready. That is exactly the shape of the problem.
An analysis assembled privately has two weaknesses that are invisible from inside it. The first is that you gathered the evidence that fitted your theory, because everyone does, and nobody was there to say the pattern disappears when you cut it a different way. The second is political rather than analytical: the people who live inside the process have been told what is wrong with their work by someone who did not ask them about it.
Both weaknesses have the same fix, and it is the same fix, which is why this Dimension is called understanding the real issue with others rather than understanding the real issue.
An analysis can be right and still be rejected, because adopting it would mean publicly accepting a diagnosis that people had no part in reaching. Being right is not the same as being adoptable.
Do not analyze alone
This is where many promising efforts become too private. Someone develops a theory, gathers only the evidence that supports it, and presents a conclusion to people who were never included. The analysis may even be correct. It will still be resisted, because the people who live inside the process were treated as an audience rather than a source.
The people closest to the work hold information that the data, the org chart and the ambitious intrapreneur do not. Frontline teams know where the process actually breaks. Past owners of the system know why it was built that way. Finance knows what has already been costed. Customers know what they experience rather than what the dashboard records.
Including people serves two purposes at once. It improves the quality of the analysis, and it begins building shared ownership before a recommendation exists.
Who holds the missing piece
- Frontline teams
- Past owners of the system
- Operations
- Finance
- Technology
- Customers
Analysis anchored in Gaining Perspective means observing, asking, listening and clarifying with each of them, not surveying them once the conclusion is written.
Find the performance gap, then stratify
Averages tell you that something is happening. Stratification helps you see where and for whom it is happening.
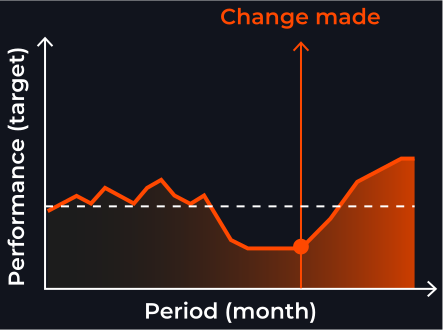
A performance gap is the distance between the expected level and the current one, over time. The point of a change is what happens after it.
Performance gap
Compare the target or expected performance with the current level. Areas with a meaningful gap often create greater receptivity to improvement ideas.
Stratification
Break the result into meaningful segments: region, channel, product, customer, tenure, process step, or time period. The pattern may disappear, or become much clearer.
A simple analytical sequence
- Define the priority metric and the expected level of performance.
- Identify the size, direction and duration of the gap.
- Stratify to find where the gap is concentrated, or where performance is strong.
- Compare the strongest and weakest segments to generate hypotheses.
- Test the hypotheses with additional data and the perspectives of people in the system.
Not all data deserves equal weight. A small change in a large revenue stream may matter more than a large change in a small one.
Move from symptom to root cause
What appears to be the problem is often an outcome produced by several connected conditions. A root cause is not simply the last "why" someone says in a meeting. It is a contributing condition that, when addressed, is reasonably expected to improve the performance gap.
Take a rise in customer complaints. The symptom is one line on a report. The conditions underneath it usually sit in four different places at once.
Process
Handoffs create delay.
People
New staff lack practice.
System
Status data is inaccurate.
Policy
Exceptions require senior approval.
Test a cause before building around it
- Does the evidence show that this condition is strongly associated with the gap?
- Can people closest to the work explain the mechanism, how it creates the result?
- Are there alternative causes that fit the data equally well?
- What would we expect to change if this cause were addressed?
- Could the proposed solution treat the symptom while leaving the system unchanged?
A worked example: late deliveries
The visible problem and the useful problem are not always the same.
A driver-training solution would have looked decisive. It would not have addressed the largest causes, and it would have told a group of people working correctly that they were the problem.
Root cause analysis, done so it holds up
A root cause is not the last "why" in a meeting. It is a contributing condition that, when addressed, is reasonably expected to improve the performance gap.
That definition is stricter than it sounds, and it rules out most of what gets called root cause analysis. "People are not following the process" is not a root cause. It is a symptom with a person attached to it. "The process requires a step that takes eleven minutes and the shift allows four" is a root cause, because you can address it and predict what should change.
The discipline is to hold a candidate cause up against five questions before building anything on it, and to be willing to lose your favorite one.
- Does the evidence show that this condition is strongly associated with the gap?
- Can the people closest to the work explain the mechanism, how it produces the result?
- Are there alternative causes that fit the data equally well?
- What would we expect to change if this cause were addressed?
- Could the proposed solution treat the symptom while leaving the system unchanged?
The fifth question is the one that saves the most time. A solution that removes the visible symptom while the underlying condition continues will look like a success for a quarter and then reappear somewhere less convenient.
Four places conditions hide
Process
Handoffs, sequencing, waiting, rework.
People
Practice, capacity, clarity of ownership.
System
Data accuracy, tooling, visibility.
Policy
Approvals, thresholds, exceptions.
Starbucks, 2008: a specific diagnosis rather than one explanation
Starbucks' fiscal 2008 filings did not treat the challenge as one undifferentiated decline. They identified lower customer traffic, the effects of rapid openings, store-level execution, portfolio quality, and infrastructure costs as connected but distinct conditions.
Performance gap
US comparable store sales declined 5% in fiscal 2008, ending with an 8% decline in the fourth quarter.
Stratification
The US business represented most consolidated revenue and was under greater pressure than the international segment.
A rigorous portfolio review identified roughly 600 underperforming US company-operated stores for closure, and the system view connected store economics, infrastructure, execution, product experience and operating discipline rather than searching for one universal explanation.
Read from the public record. Starbucks did not use or endorse this framework, and the case mapping is interpretive rather than a causal claim.
A useful diagnosis made it possible to act differently in different parts of the system. That is what stratification buys you, at any scale.
Common questions
- What does Analyze mean in the Intrapreneurship Journey?
- Analyze is the second Dimension. It means understanding the real issue with other people rather than alone: identifying the performance gap, stratifying the data to find where the gap is concentrated, and moving from symptom to root cause.
- What is the difference between a symptom and a root cause?
- A symptom is what shows up on a report. A root cause is a contributing condition that, when addressed, is reasonably expected to improve the performance gap. A root cause is not simply the last why someone says in a meeting.
- Why does stratification matter?
- Averages tell you that something is happening. Stratification tells you where and for whom. A result that looks like a 4% decline overall can be a 7% decline in one segment and an improvement in another, and those are two different problems.
- Why should analysis include other people?
- Because the people closest to the work hold information the data and the org chart do not, and because including them improves the analysis while building shared ownership before a recommendation exists.